June 1, 2022

    How to Create Reports in Microsoft Dynamics 365 Business Central

    All good financial reporting starts with a well-designed chart of accounts. The chart of accounts in Microsoft Dynamics 365 Business Central (BC) has key differences from Microsoft Dynamics GP (formerly Great Plains). Here’s a closer look at financial, operational and analytical reporting options in Business Central. 

    Report Development in Microsoft Dynamics GP vs. Business Central 

    Dynamics 365 Business Central dimensions assigned to accounts makes analyzing records simpler than the segments and analytical accounting or Multidimensional Analysis (MDA) functionality in GP.  

    In Dynamics 365 BC, everything starts with a main account; that account is grouped into assets, liabilities, equity, income, Cost of Goods Sold and expense. Then you can create custom sub-categories.  

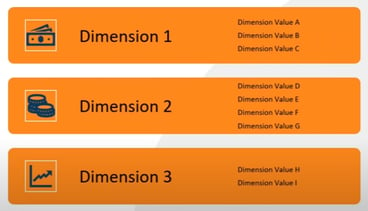
    Dimensions are used to group or categorize data for analysis purposes. For example, instead of setting up general ledgers for each department or project, you can use dimensions to avoid complicating your chart of accounts. There is no limit to the number of dimension values you can have. The importance of these values lies in your ability to conduct meaningful analysis. 

    Table

Description automatically generated

    A single sales entry, for example, can include information from multiple dimensions, such as the account the item belonged to, where the item was sold, who sold the item and who the customer was. 

    Much like with any kind of intelligence tool, the more dimensions and dimension values you use, the more detailed the reports.  

    Types of Reports in Dynamics 365 Business Central 

    Financial Reporting 

    Account schedules are part of the core functionality of Business Central, while third-party reporting options are add-on applications. 

    Account schedules in Dynamics 365 BC are similar to the advanced financials in GP. They share characteristics with Management Reporter, but don’t have the same level of functionality or flexibility. Users can gain insight into the financial data stored in their chart of accounts, analyze figures in general ledger accounts or compare data between the general ledger and budget entries. 

    Business Central has four default, pre-installed account schedules, which are the basis of standard financial reports. These system-generated account schedules update automatically. If these default templates don’t match your business needs, you can copy an existing account schedule or create a new one. You can also preview all account schedules at any time.  

    One of the main functions of account schedules is acting as a place for calculations that can’t be directly completed in the chart of accounts. Users can tally profit margins based on certain dimensions such as department or customer groups or arrange account lists to better present information. 

    Microsoft Dynamics GP users may be familiar with Management Reporter, a tool that supports financial reporting within that platform. However, while Management Reporter isn’t used with Dynamics 365 Business Central, many third-party report writers work well with BC. Your reporting needs will determine which is best suited for your business.  

    One example of a tool that many companies use within Business Central is Jet Reports, an Excel-based tool. It requires zero coding or programming skills, so anyone on your team can explore data and create or modify reports quickly. Easily generate timely, accurate financial reports in the format that works best for you, all while using the same Excel fields and calculations you’re used to. You can create cashflow statements with segmented time periods, varying by year, month or quarter. Review income statements for date comparisons and create graph visualizations.  

    For financial reporting that doesn’t originate with general ledger account balances, users can create sales and profit information for top customers in a given range, drilling down into specific customer segments, or look at open sales within a given shipment range. Date slicers enable you to filter based off time periods.  

    Operational Reporting 

    Operational reports provide detailed insight into everyday business processes and workflow.  

    Query Tools: Smart List vs. Popdock 

    The Popdock widget is the Business Central equivalent of using SmartList in Dynamics GP. This third-party application is a self-service Business Intelligence (BI) tool that allows users to access all cloud-based application data in one app. Popdock reports are based on live data. This real-time reporting is especially helpful for making important business decisions. The application provides data-driven access plans as well as actionable data; you can complete tasks without logging into the native application. You can leverage its built-in extension widget to Business Central. Popdock gives you the same functionality as SmartList plus some additional features. 

    Out-of-the-Box Reports 

    Microsoft Dynamics GP reports in the Report Writer tend to require more training, and modifications to standard reports require more advanced skills. 

    A similar but easier-to-use feature exists in Dynamics 365 Business Central. Any report that is viewed, printed or saved from Business Central must have a report layout, which can be found by searching for Report Layout in Business Central. This controls the content and format of the report; Dynamics 365 Business Central has a list of layouts to choose from. Report layouts can be created from Report Definition Language or in Word. Users can modify PDF reports to send to customers or adjust Word layouts, such as the arrangement of data in columns or general formatting of font and size. 

    Modification of any Dynamics 365 Business Central report layout requires making a copy of the original, exporting the layout and making changes from there. Once adjustments have been made, the report is imported back into Business Central. Users can opt for default, built-in report layouts or create one from scratch.  

    Analytical Reporting with Microsoft Power BI 

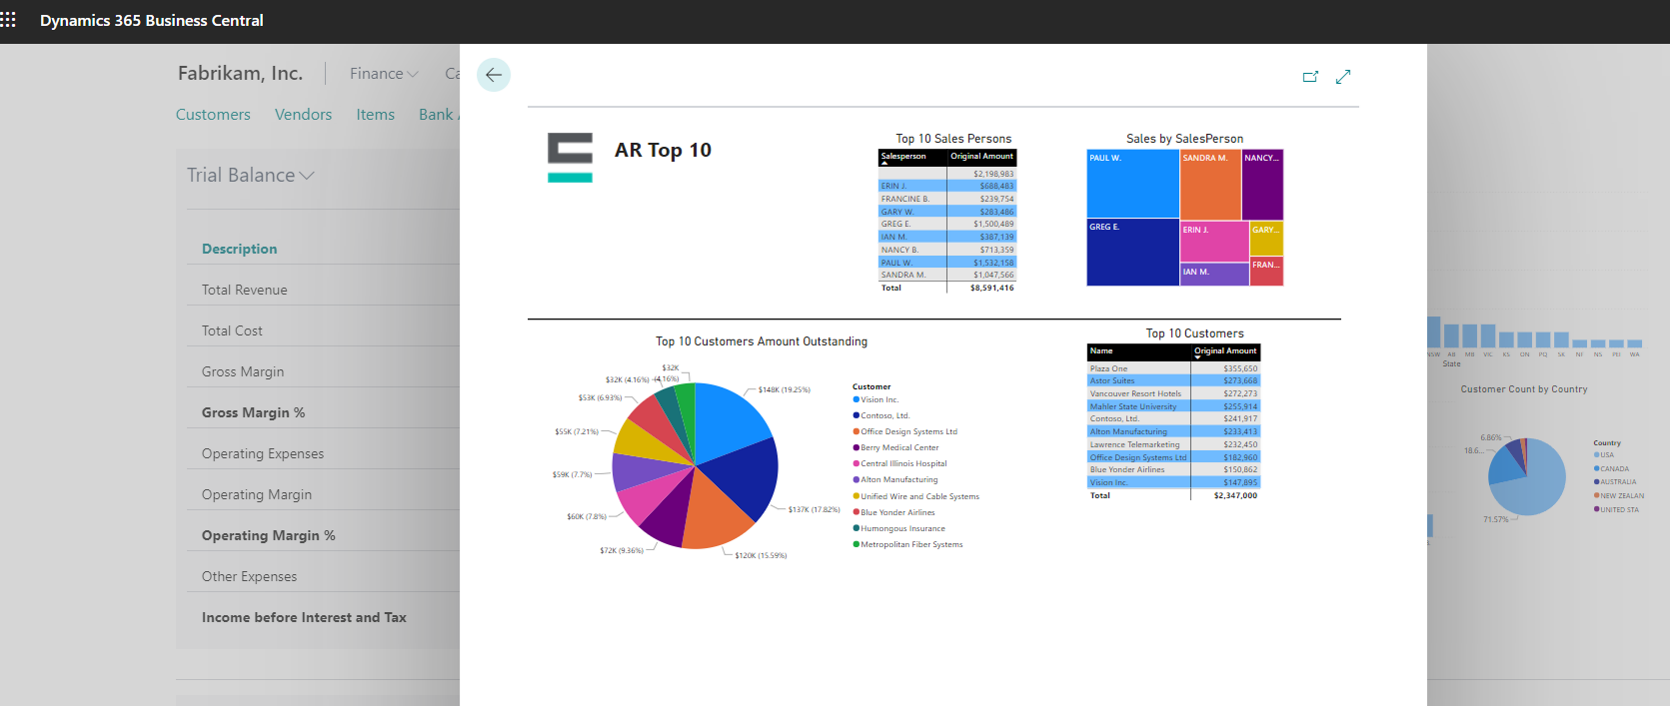
    Power BI is a collection of software services, apps and connectors — Power BI desktop, service and mobile — that work together to leverage your data and turn it into coherent, helpful information with interactive insights. It can be used with either Dynamics GP or Dynamics 365 Business Central.

    Graphical user interface, application, Excel

Description automatically generated

    The desktop version is where data consolidation and reporting work is performed. After data from Business Central, current or historic Dynamics GP data, Azure datalake, SQL server, Excel workbooks and local databases is inputted, you can create new or use pre-configured visualizations and dashboards to display within BC. To use Power BI with Dynamics 365 Business Central, the user must have a license for both. 

    If you’re interested in learning more about how Business Central financial reporting can work for your company, connect with our team of experts. Or to learn more about other ways Dynamics 365 Business Central can benefit your business, access our on-demand demo below.

    See Dynamics 365 Business in Action


    Stephanie Clark

    Stephanie, Enavate's SMB Delivery Leader, is a proven technology executive focused on building consulting practices and leading teams through complex industry focused projects. As a delivery leader spanning across many industries, she is passionate about helping clients grow their business through technology.

    Enavate Recent Posts

    January 16, 2025

    Fewer People are Drinking Wine. How Can Wineries Do More with Less? 

    Wineries in the United States have noticed a worrying trend in recent years, as overall demand for wine has continued to go down. Silicon Valley Bank noted in its 2024 State... Read More
    January 9, 2025

    Microsoft Dynamics GP Year-End Close: AP & 1099 Processing

    Knowing how to close out your Microsoft Dynamics GP instance can be difficult if you don’t know best practices and how to streamline the process. At Enavate, we can assist... Read More
    January 9, 2025

    How Do Microsoft Dynamics 365 Business Central and Sage Intacct Compare?

    Small- and medium-sized businesses can significantly improve their operational efficiency and productivity by upgrading to a modern, Cloud-based ERP system. The thing is,... Read More

    Subscribe to Receive Email Updates