Some gravitate to Microsoft Power BI to bring harmony to multiple data sets and others want to streamline their reporting processes. But above all, most want to tap into the power of analytics so they can make meaningful changes in their organizations.
With Power BI, you can get your employees on the same page, collaborating in a sophisticated platform and manipulating data with ease. You are empowered to pull insights, analyze and compare historic and real-time data, create effective reports and make predictions based on trends. From there, you can make decisions that enhance your business, from broad process improvements to granular daily operations.
Power BI is a Cloud-based analytics and reporting platform from Microsoft. With it, businesses can pull data from multiple sources into one centralized location. There, the data is harmonized so users can perform analytics and find insights into company performance across functions.
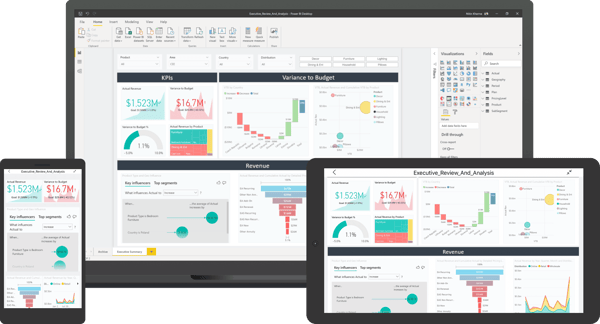
The platform offers hundreds of options for visualizing data and creating reports. And customizable dashboards make it easy to manipulate these visuals, find insights, share reports and collaborate – even on mobile.
Diving deep into data is so simple with Power BI that anyone at an organization can use insights to make actionable, transformative decisions.
Power BI is one of the most popular business intelligence tools on the market. And it just keeps getting better. Microsoft is continually updating the platform to meet the needs of today’s users, a key benefit when how we work has changed so drastically over the past year, and the value of real-time analytics has risen to the forefront.
Oganizations choose – and love – Power BI because:
No matter your skill set, learning to use Power BI is easy. You can start making great strides with the tool right away. You don’t need to be an analytics expert to get results. Businesses can inspire a data-centric culture and empower their employees to use analytics every day in their reporting, planning and decision-making processes. Additionally, Power BI is designed in a way that is intuitive to Microsoft users, especially those familiar with Excel.
Users can easily design their dashboards to follow track metrics that are important to them. Such customization can happen at either an individual, team or department level. Users can choose data that’s specific to their purposes, apply their preferred visualizations to display and connect that data, and share and collaborate on their findings seamlessly within the platform. This is more efficient and actionable, allowing users spend their time on information that’s most relevant to them.
Power BI can seamlessly pull a vast amount of data from many types of sources. This means you can unify data from different areas of your business, regardless of whether it’s on-premises or in the Cloud. That includes sources like Dynamics 365, SharePoint, Excel, Azure SQL Server and other cloud and on-premise data sources. You can then transform and model that data for optimal use in Power BI using simple, Excel-like tools.
There are hundreds of visualizations to choose from to build attractive, compelling visuals and reports. How we view data can have a significant impact on how we perceive and understand it. Users can choose visuals that strike the right chord with their own sentiments, sending themselves signals through their own design. And they can enhance their reports for presentations and sharing so the information is immediately understood. With the right mix of visuals, users can make statements, justify requests and decisions, confirm results and inspire action.
With cohesive and beautifully displayed data at your fingertips, you’ll easily spot opportunities for improvement and transformation within your organization. You can optimize everything from spending to logistics, operations, customer relationships and employee performance (to name a few). You can even use Power BI’s machine learning capabilities to make forecasts for your business. And if you aren’t sure where to start, features like quick insights and Q&A can guide you toward useful information.
Your decisions will be informed by the latest, most accurate data about your organization. And you’ll be empowered to be responsive should things take a turn for the worst, or even the best – a valuable capability in uncertain times.
Perhaps best of all, these actionable insights won’t be exclusively held by you or your business intelligence team. If you put this in the hands of individuals and teams across your organization, you’ll have eyes on all corners of your operations.
Companies across the globe are using Power BI to solve problems, become more efficient, and achieve new ambitions.
Using Power BI, The Associated Press (AP) was able to deliver live data visualizations of election results to its member news organizations during an important primary election in Virginia. Those news organizations could share sophisticated, interactive visualizations with readers. They could also drill down into the results at the county level. The data was also set up to refresh frequently so the visualizations reflected results in real time.
Condé Nast started using Power BI in 2013 to centralize and manage data analytics for their multiple brands. They also wanted to expand their capabilities so they could get proactive in sending helpful insights to their brands. Previously, the company’s marketing analytics team used several tools to manage the data sets of each brand, so there were frustrating inefficiencies and shortcomings. With Power BI, they quickly found insights they could use to better understand each brand’s market, performance and customers, so they could make informed improvements.
Banfield Pet Hospital used Power BI to move away from limited and inefficient reporting processes that kept their staff busy with time-consuming data entry and restricted executives’ visibility over company performance. They moved from static Excel spreadsheets and PDFs to sophisticated, uniform data visualization for more than 1,000 locations. Executives have gained a clearer, real-time perspective over their business. And individual locations can use analytics and collaboration to improve operations, patient care, marketing, finance and more.
The possibilities with Power BI are great, and they’re constantly expanding. Get in touch with one of our experts to learn more about how you can use this powerful analytics platform to make better business decisions and achieve your goals.
Melissa Grover is a Senior Solutions consultant for Enavate Managed Services, a DXC Services Partner. She has over 20 years supporting ERP solutions for small to medium range companies with a primary focus on Microsoft Dynamics software. She has strong organizational, technical and troubleshooting skills. She enjoys running, hiking and spending time with family and friends.